
The Vietnam hotel market is in a demand-led upswing. Room demand rose 14.1% in the year to May while supply rose 2.8%, lifting occupancy to 63.9% and ADR to US$124.02, according to CoStar data reported by Ariyana. For owners, operators and revenue leaders, the questions for the rest of 2026 are whether the fourth quarter brings the arrivals the national target needs, and how fast the 38,354 rooms under construction will open.
This Vietnam hotel market report sits behind our homepage market snapshot. It takes each of the snapshot’s six numbers in turn, then covers source markets, the monthly trend, costs, the supply pipeline and the main city and resort markets. Every figure is sourced; anything we calculated is marked as ours.
Key facts
- International arrivals: 17.7 million in January–September 2026, up 14.5% year on year (National Statistics Office)
- Target: about 71% of the government’s 25 million target reached by the end of September
- Demand and supply: room demand +14.1%, room supply +2.8%, year to May 2026 (CoStar via Ariyana)
- Occupancy: 63.9% year to date, against 58.4% for the whole of 2025
- ADR: US$124.02 year to date, against US$110.57 for 2025. RevPAR US$79.21, against US$64.54
- Five-star stock: 291 establishments with 94,819 rooms at the end of 2025 (VNAT)
- Pipeline: 38,354 rooms under construction in CoStar’s sample of 196,224 rooms
- Costs: consumer prices up 4.52% on average in January–September, above the government’s target of about 4.5%
International arrivals: 17.7 million, up 14.5%
Vietnam welcomed 17.7 million international visitors in the first nine months of 2026, the NSO said, the highest nine-month total in many years. Every quarter grew by more than 12% on 2025.
| Period | Arrivals | Change on a year earlier |
|---|---|---|
| Q1 2026 | 6.76 million | +12.4% |
| Q2 2026 | 5.49 million | +18.2% |
| Q3 2026 | about 5.4 million | +13.8% |
| January–September 2026 | 17.7 million | +14.5% |
| 2025 full year | nearly 21.2 million | +20.4% |
Growth has held above 12% in every quarter, so 2026 demand is broad-based rather than a one-off peak.
What it means for owners, operators and revenue leaders: a 14.5% rise in arrivals is the base for room demand. Budget against that rate, not 2025’s 20.4%, which came off a lower base.
The 25 million target: 71% reached
The government’s Resolution 01/NQ-CP sets a target of 25 million international arrivals in 2026. By the end of September, Vietnam had reached about 71% of it.
| Measure | Figure |
|---|---|
| 2026 target | 25 million |
| Arrived, January–September | 17.7 million (about 71%) |
| Still needed, October–December | about 7.3 million (our calculation) |
| Growth on 2025 needed to hit the target | about 18% (25 ÷ 21.2, our calculation) |
What it means for owners, operators and revenue leaders: the target is a policy goal, not a forecast. Our view: do not build 2027 budgets on the assumption that 2026 ends at 25 million.
Monthly arrivals trend
The NSO publishes a monthly estimate. Arrivals peaked in January and were lowest in June and July, and every month grew on 2025.
| Month, 2026 | Arrivals | Change on a year earlier |
|---|---|---|
| January | 2.45 million | +18.5% |
| February | 2.23 million | +17.7% |
| March | 2.08 million | +1.3% |
| April | 2.03 million | +22.8% |
| May | 1.78 million | +16.5% |
| June | 1.68 million | +14.7% |
| July | 1.67 million | +6.6% |
| August | 1.99 million | +18.4% |
| September | 1.77 million | +16.1% |
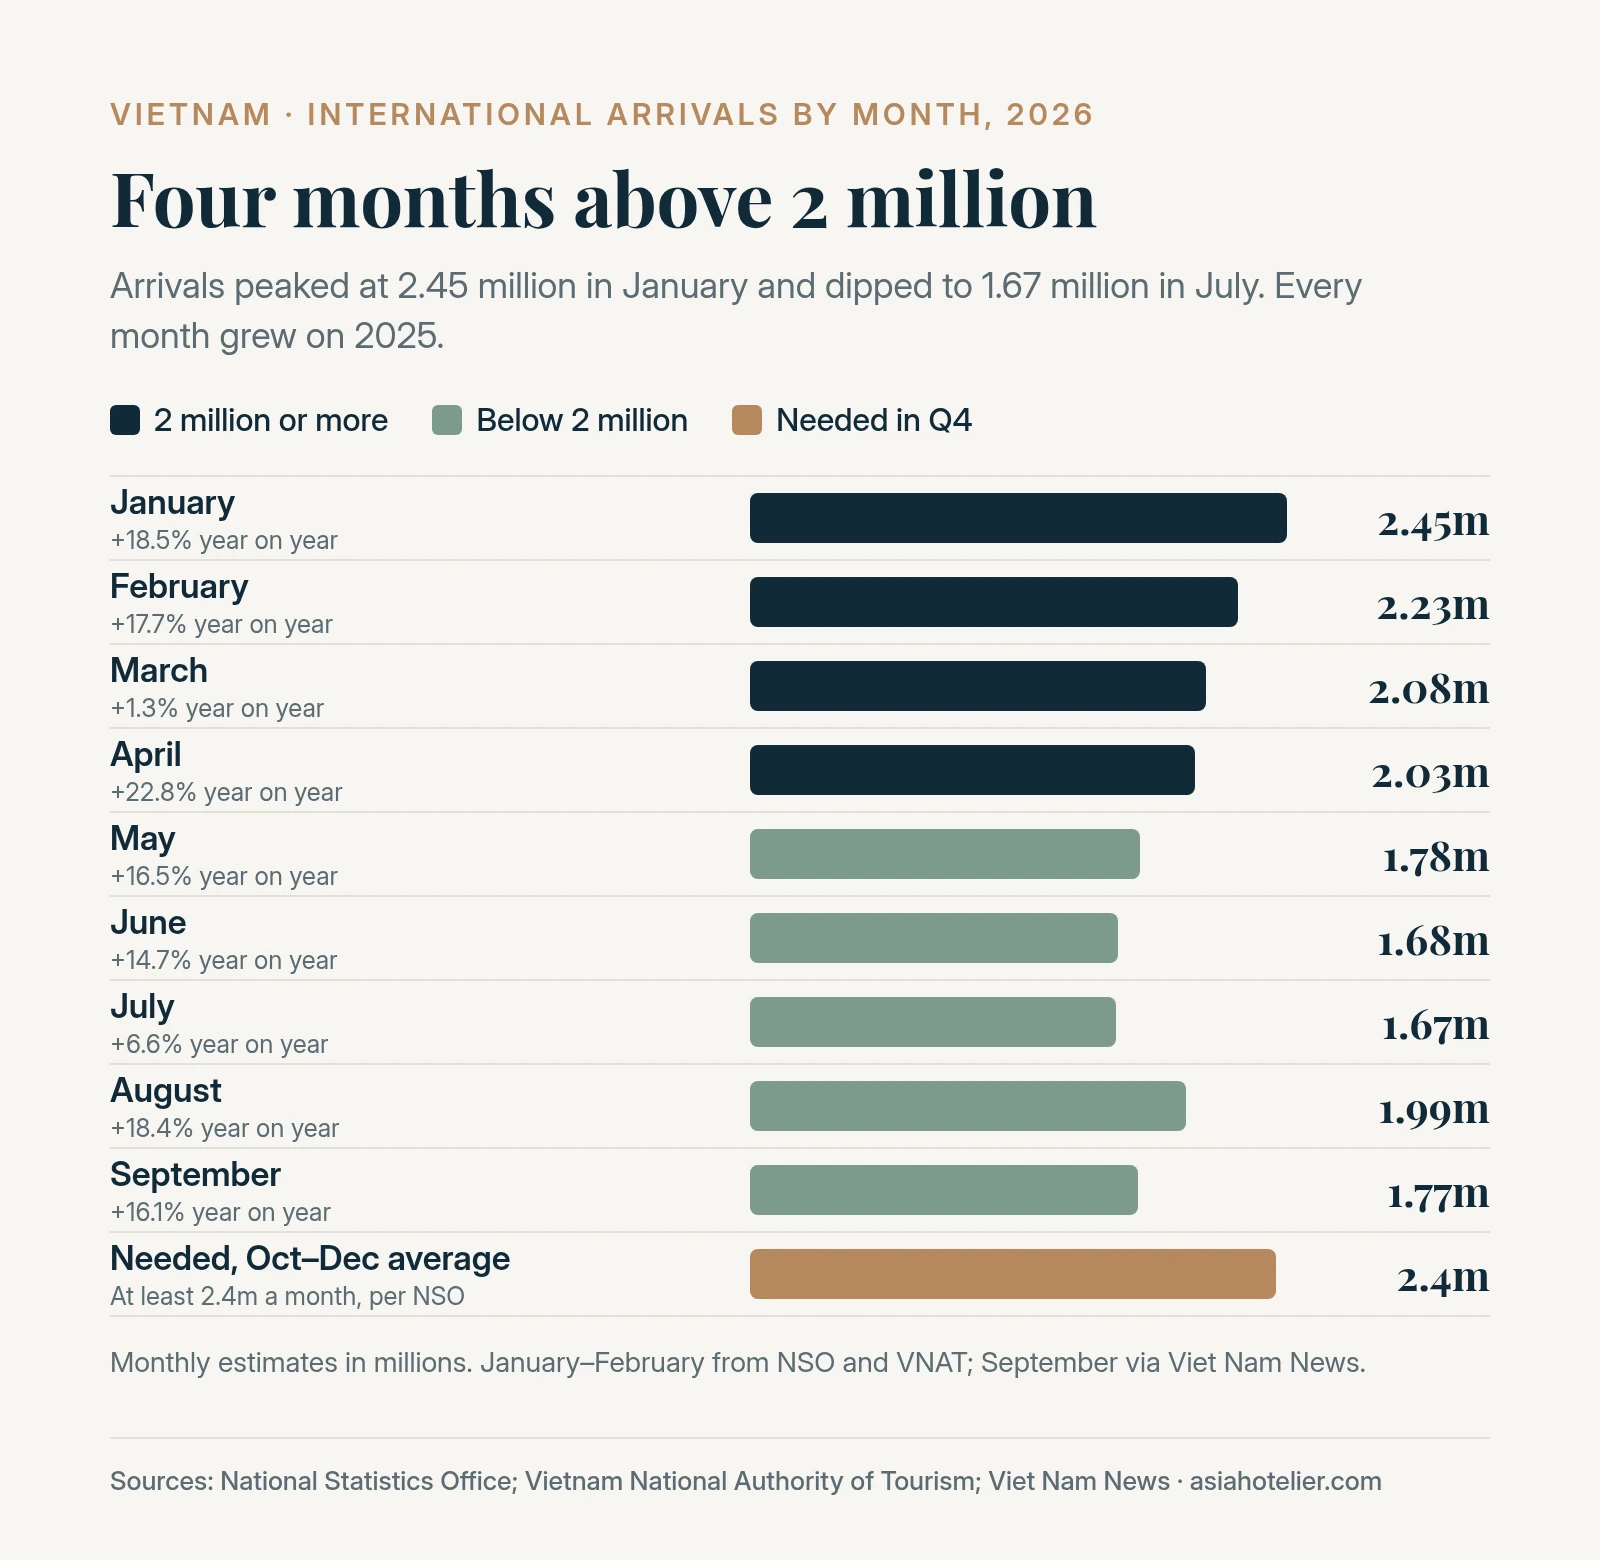
Takeaway: the fourth quarter needs three months at about January’s record level, about 37% above September. Build Q4 forecasts on your own pickup and booking pace, not on the national target.
The fourth-quarter run rate
To reach 25 million, arrivals must average at least 2.4 million a month in October–December, the NSO said. Viet Nam News notes that October to March is Vietnam’s international peak season.
| Benchmark | Arrivals a month |
|---|---|
| Needed, October–December (NSO minimum) | 2.4 million |
| Best month of 2026 (January) | 2.45 million |
| Average month, January–September (our calculation) | about 1.97 million |
| September 2026 | about 1.77 million |
| Q4 2025, average month (our estimate) | about 1.9 million |
Our estimate puts the fourth quarter of 2025 at about 5.7 million arrivals, derived from the NSO’s rounded totals. Delivering 7.3 million this quarter would mean growth of about 27% on that, nearly double the 14.5% pace so far.
Source markets
The NSO’s latest breakdown covers January–August. Asia supplied 74.2% of arrivals but grew only 7.4%. Europe grew 53.4%, driven by Russia.
| Region, January–August 2026 | Arrivals | Share | Change |
|---|---|---|---|
| Asia | 11.8 million | 74.2% | +7.4% |
| Europe | 2.7 million | 16.8% | +53.4% |
| Americas | 887,400 | 5.6% | +20.7% |
| Oceania | 488,700 | 3.1% | +23.3% |
| Africa | 44,800 | 0.3% | +25.1% |
| Market, January–August 2026 | Arrivals | Change |
|---|---|---|
| China | 3.5 million | +0.3% |
| South Korea | 2.8 million | −5.2% |
| Russia | 1.0 million | +165.7% |
| Taiwan | 861,000 | +2.6% |
| United States | 689,500 | +20.4% |
| India | 612,400 | +38.2% |
| Japan | 589,300 | +9.2% |
| Australia | 441,400 | +23.3% |
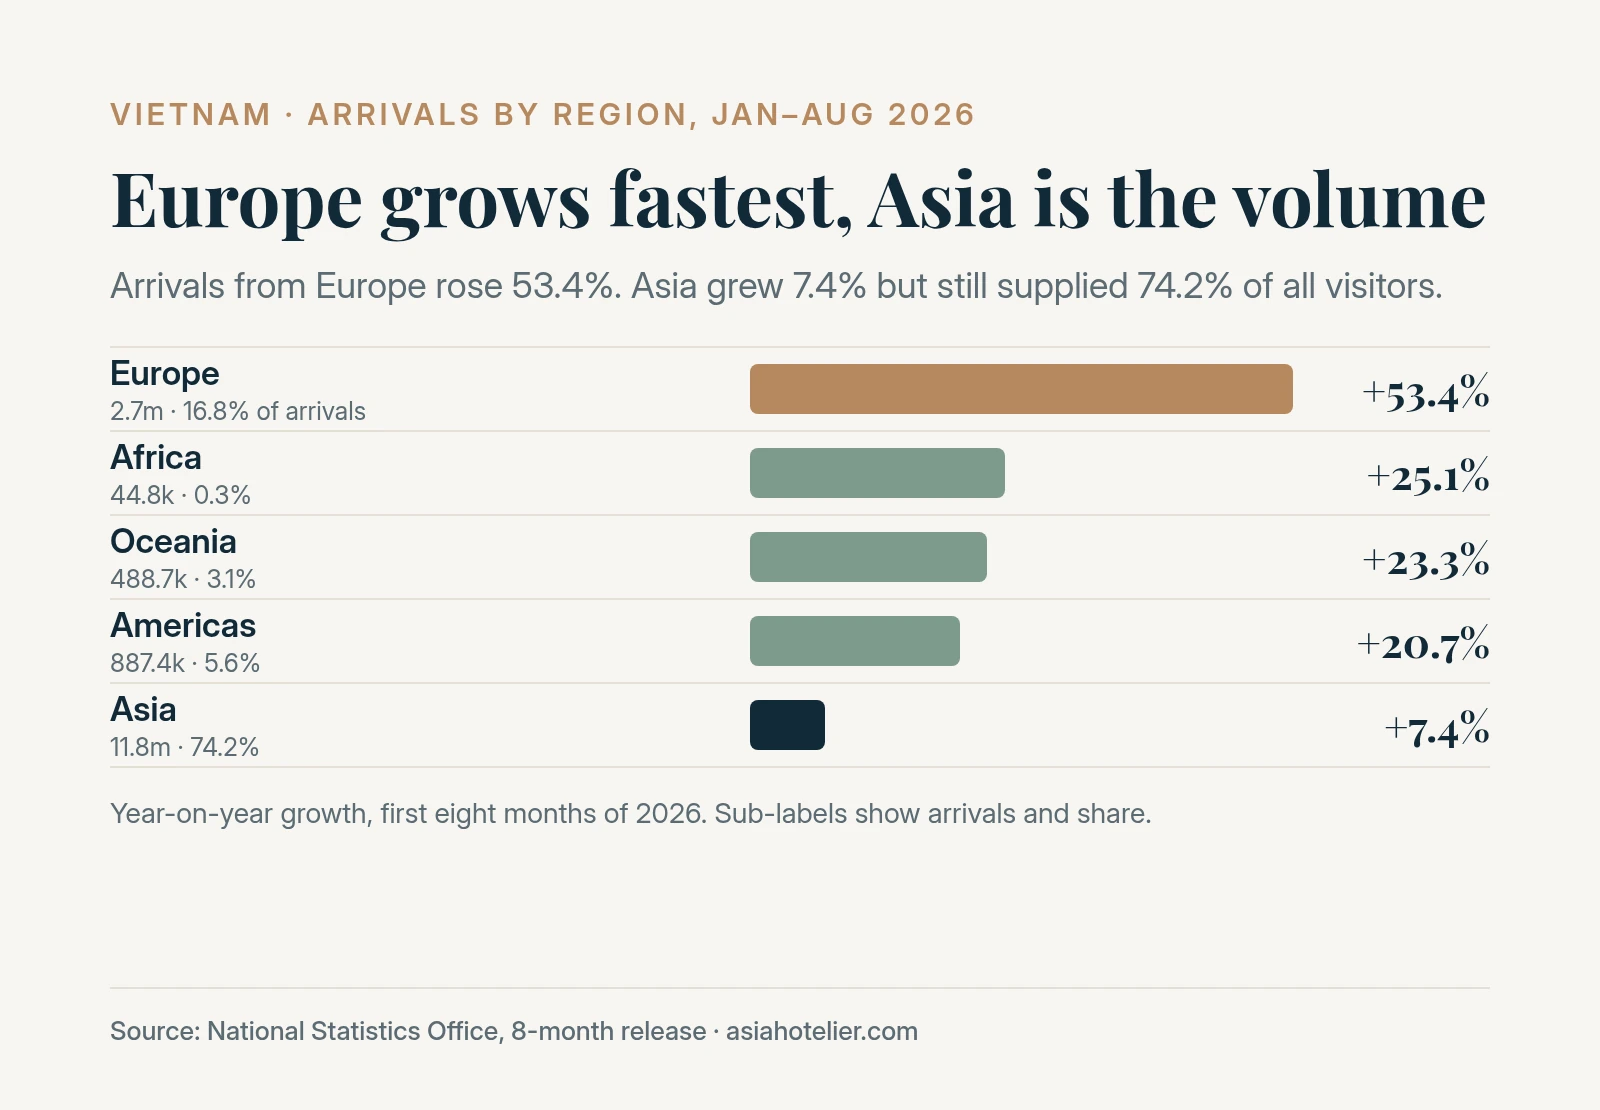
Takeaway: Europe is where the growth is, but Asia is still three-quarters of the volume. Shift some sales and distribution effort towards Europe and long-haul markets without cutting Asian channels.
China and South Korea, the two largest markets, were flat or falling, so growth came from long-haul and newer markets. Other European markets also grew: Poland 51.2%, Germany 15.1%, France 13.4% and the United Kingdom 9.8%. In South-east Asia, the Philippines rose 58.8%, Singapore 31.7% and Malaysia 20.5%.
Room demand is growing five times faster than supply
CoStar’s national report, updated on 2 July 2026, shows room demand (rooms sold) up 14.1% year to date and room supply (rooms available) up 2.8%, according to Ariyana. International arrivals grew 14.9% in January–May, the NSO reported.
| Measure, year to May 2026 | Change |
|---|---|
| Room demand (CoStar) | +14.1% |
| Room supply (CoStar) | +2.8% |
| International arrivals, January–May (NSO) | +14.9% |
| Demand growth ÷ supply growth (our calculation) | about 5 times |
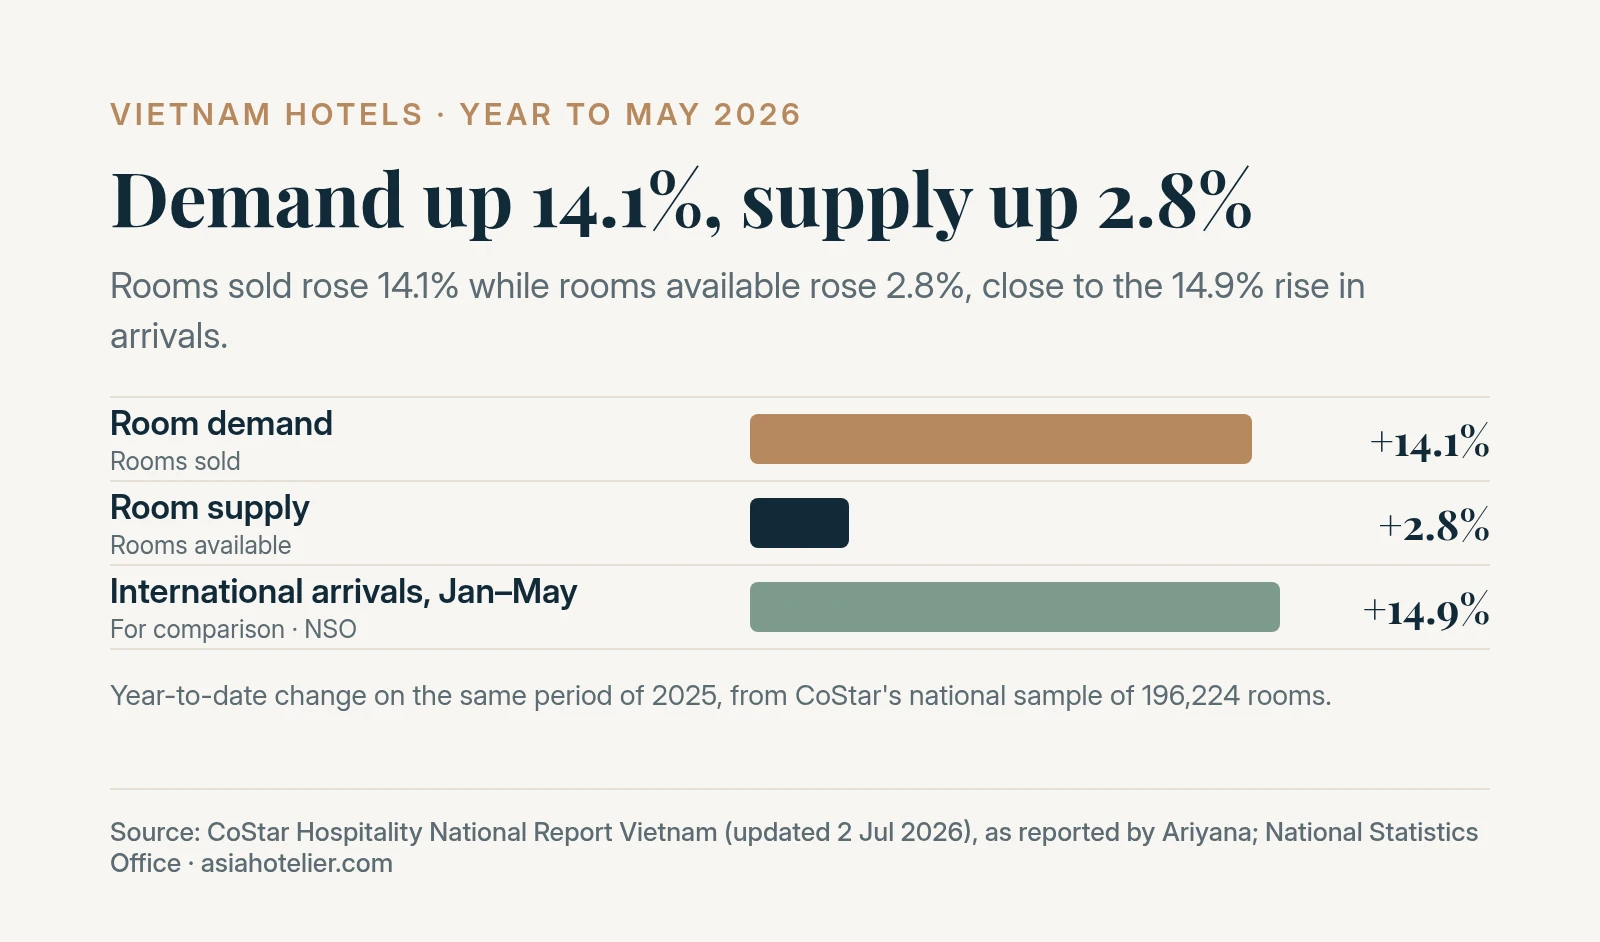
Takeaway: demand is tracking arrivals while supply lags, which supports holding or raising rate wherever the local pipeline is thin.
What it means for owners, operators and revenue leaders: when demand outruns supply, hotels can push rate. Our view: hold rate in markets with little new supply, and check local pipelines before assuming the national trend applies.
Occupancy: 63.9% year to date
CoStar put year-to-date occupancy at 63.9%, against 58.4% for the whole of 2025. Luxury hotels did best and midscale and economy hotels fell.
| Segment | Occupancy |
|---|---|
| All hotels, 2025 full year | 58.4% |
| All hotels, 2026 year to date | 63.9% |
| Luxury & Upper Upscale, 2026 year to date | 66.6% |
| Upscale & Upper Midscale, 2026 year to date | 63.8% |
| Midscale & Economy, 2026 year to date | 44.3% (down 7.1%, as reported) |
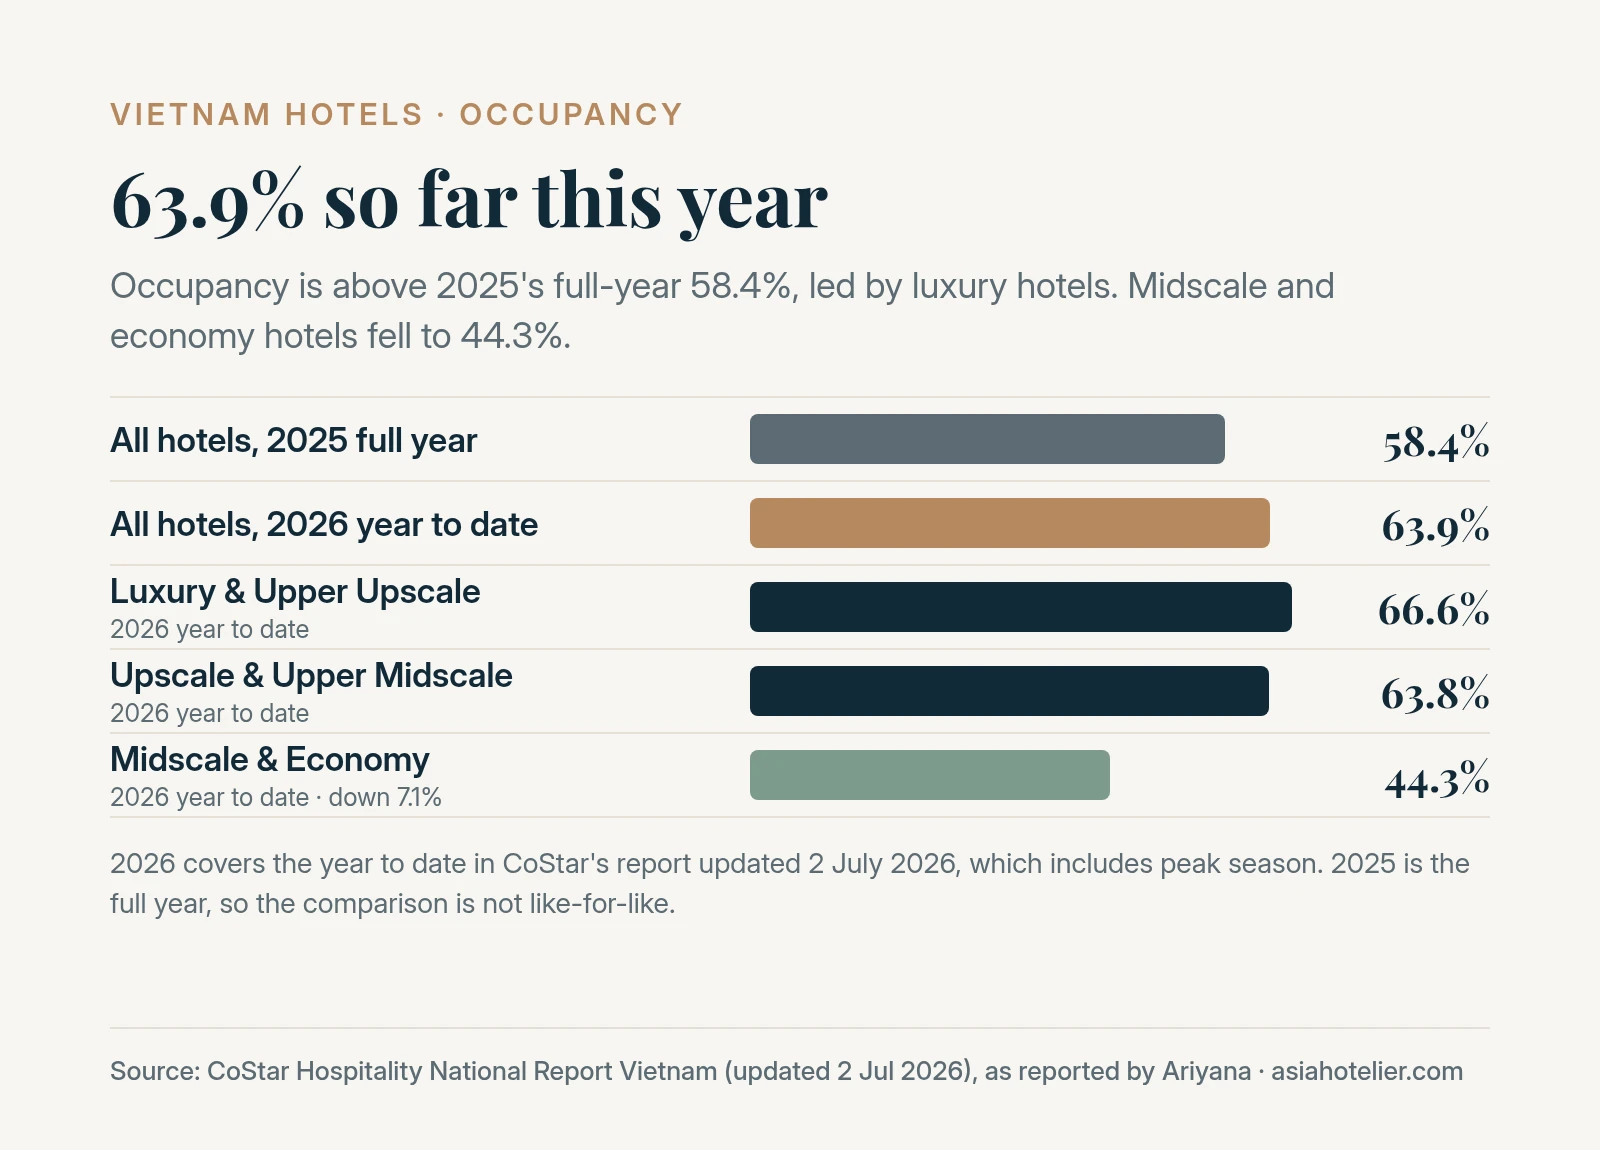
Takeaway: the recovery is in the upper tiers. Midscale and economy owners should review positioning and costs rather than wait for the national trend to lift them.
What it means for owners, operators and revenue leaders: the 2026 figure covers the first five months, which include Tet and the international peak, so expect the full-year number to be lower. Midscale and economy owners face a different market from luxury ones, and Ariyana points to competition from homestays, serviced apartments and other alternatives.
ADR: US$124, up on 2025
ADR was US$124.02 year to date, against US$110.57 for the whole of 2025. RevPAR was US$79.21, against US$64.54. On CoStar’s own basis, ADR rose 11.9% and RevPAR 24.2%.
| Measure | 2025 full year | 2026 year to date | Change, as reported |
|---|---|---|---|
| ADR, all hotels | US$110.57 | US$124.02 | +11.9% |
| RevPAR, all hotels | US$64.54 | US$79.21 | +24.2% |
| ADR, Luxury & Upper Upscale | Not reported | US$162.41 | RevPAR +25.7% |
| ADR, Upscale & Upper Midscale | Not reported | US$82.64 | RevPAR +28.9% |
| ADR, Midscale & Economy | Not reported | Not reported | ADR +14.9% |
Rate and occupancy are rising together, so RevPAR is growing about twice as fast as ADR.
What it means for owners, operators and revenue leaders: Vietnam’s hotels are winning on rate as well as volume. Our view: the bigger risk is pushing rate faster than service quality, which Ariyana flags as a threat to review scores.
Five-star stock: 291 hotels, 94,819 rooms
Vietnam had 291 five-star accommodation establishments with 94,819 rooms at the end of 2025, according to VNAT figures cited in Tạp chí Kinh tế Tài chính. A year earlier the ministry counted 268 five-star hotels with 87,563 rooms.
| Five-star | End of 2024 | End of 2025 | Change |
|---|---|---|---|
| Hotels or establishments | 268 | 291 | +23 |
| Rooms | 87,563 | 94,819 | +7,256 (+8.3%) |
| Average rooms each (our calculation) | 327 | 326 | about the same |
Five-star rooms grew 8.3% in 2025, much faster than the 2.8% growth in CoStar’s total supply.
What it means for owners, operators and revenue leaders: most new supply is going in at the top. Luxury owners should expect more direct competition than the national supply figure suggests. See how many hotels are in Vietnam for every star class and the five-star split by province, and our MICHELIN Key analysis for the 21 Key hotels.
Costs
Revenue is rising, but so are costs. CoStar’s profitability data for full-service hotels in 2024, the latest year reported, shows profit growing fast but utilities growing faster.
| Full-service hotels, 2024 | Per room | Change on 2023 |
|---|---|---|
| Total revenue | US$65,920 | +22.9% |
| Gross operating profit (GOP) | US$25,824 | +34.9% |
| EBITDA | US$22,822 | +35.5% |
| Utilities | Not reported | +38.2% |
| Sales & marketing | Not reported | +16.7% |
| Labour | 24.3% of total revenue | Not reported |
| Price pressure, 2026 | Figure |
|---|---|
| Consumer prices, January–September average | +4.52%, above the target of about 4.5% |
| Consumer prices, September | +5.08% year on year |
| Prices of materials and fuel used in production, January–September | +5.12% |
| Accommodation and food service revenue, January–September | +16.7% at current prices, against +12.8% for retail |
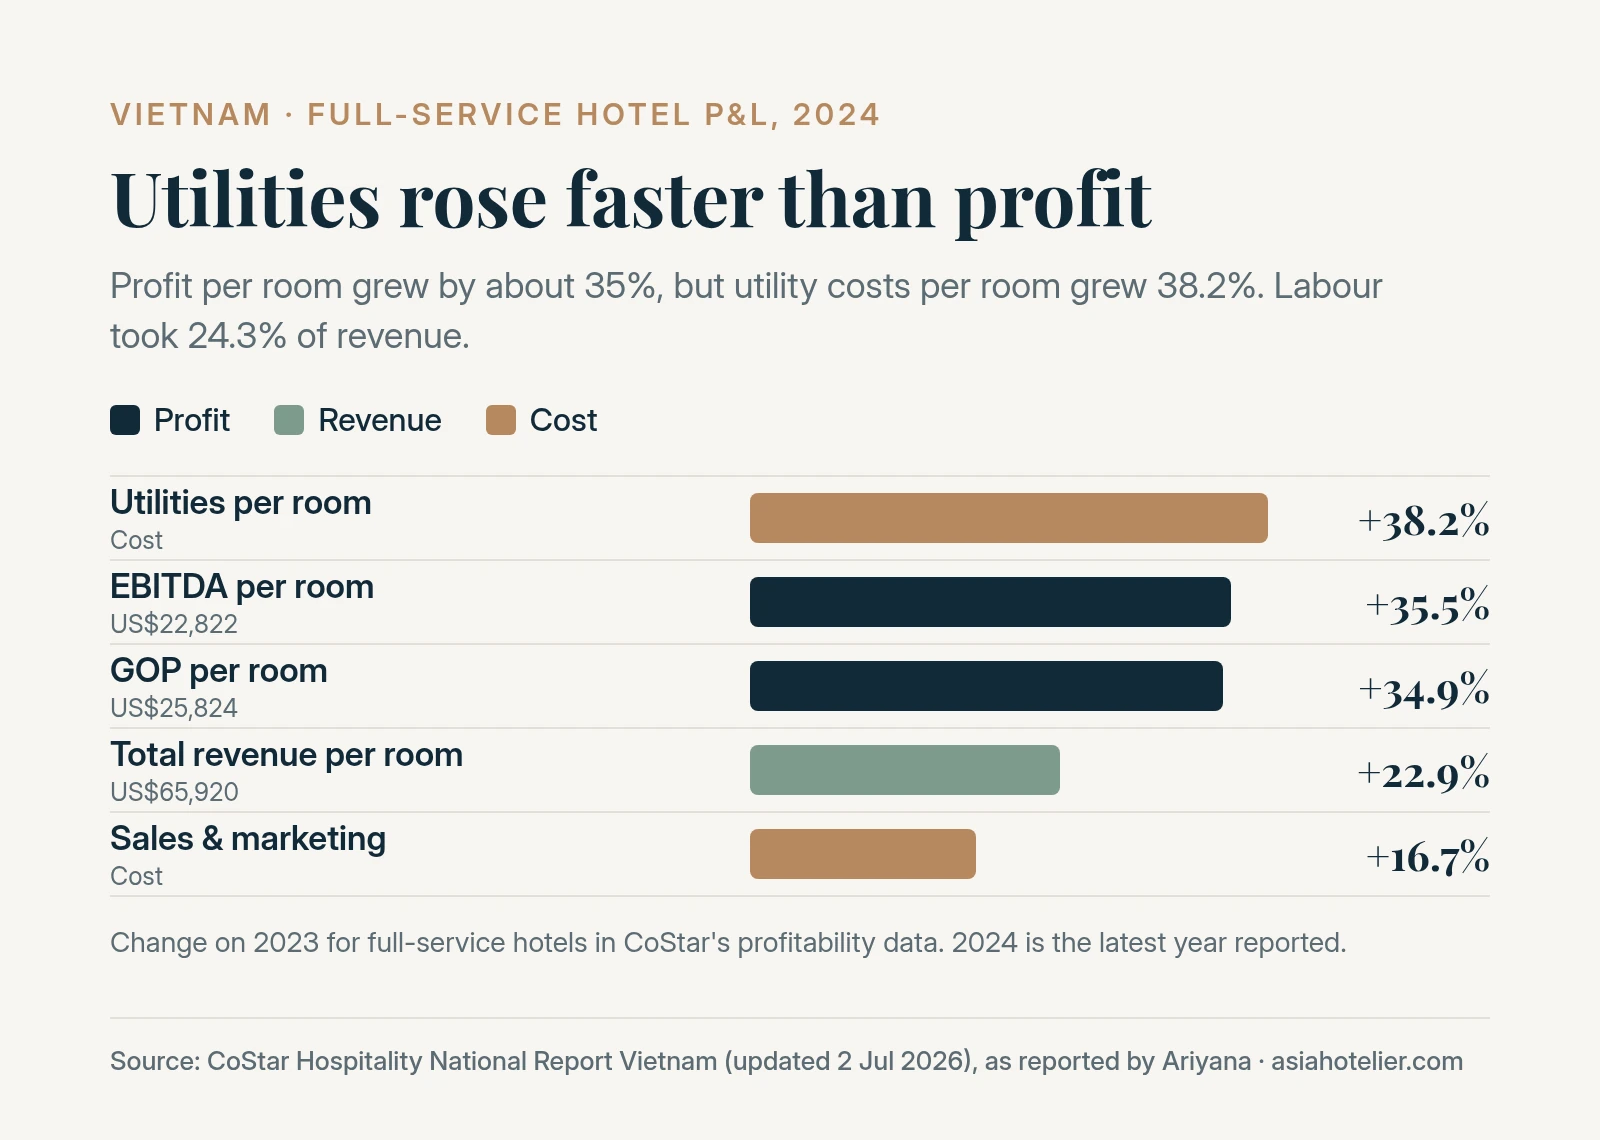
Takeaway: utility costs per room rose faster than profit in 2024, and inflation is running above target in 2026. Put energy and other cost lines on the 2027 budget agenda, not only revenue.
The NSO said higher input costs reduced the real growth in retail and consumer-services revenue, which includes accommodation and food. By our calculation, GOP was 39.2% of total revenue for full-service hotels in 2024.
Supply pipeline
CoStar counts 38,354 rooms under construction, about a fifth of the 196,224 rooms in its sample.
| Rooms under construction | Rooms | Share of tracked stock in the region |
|---|---|---|
| Vietnam Central & North | 27,028 | 19.9% of 135,526 |
| Vietnam South | 11,326 | 18.7% of 60,698 |
| Total | 38,354 | 19.5% of 196,224 |
| of which Luxury & Upper Upscale | 15,586 | |
| of which Upscale & Upper Midscale | 20,420 | |
| of which Midscale & Economy | 2,348 (our calculation) |
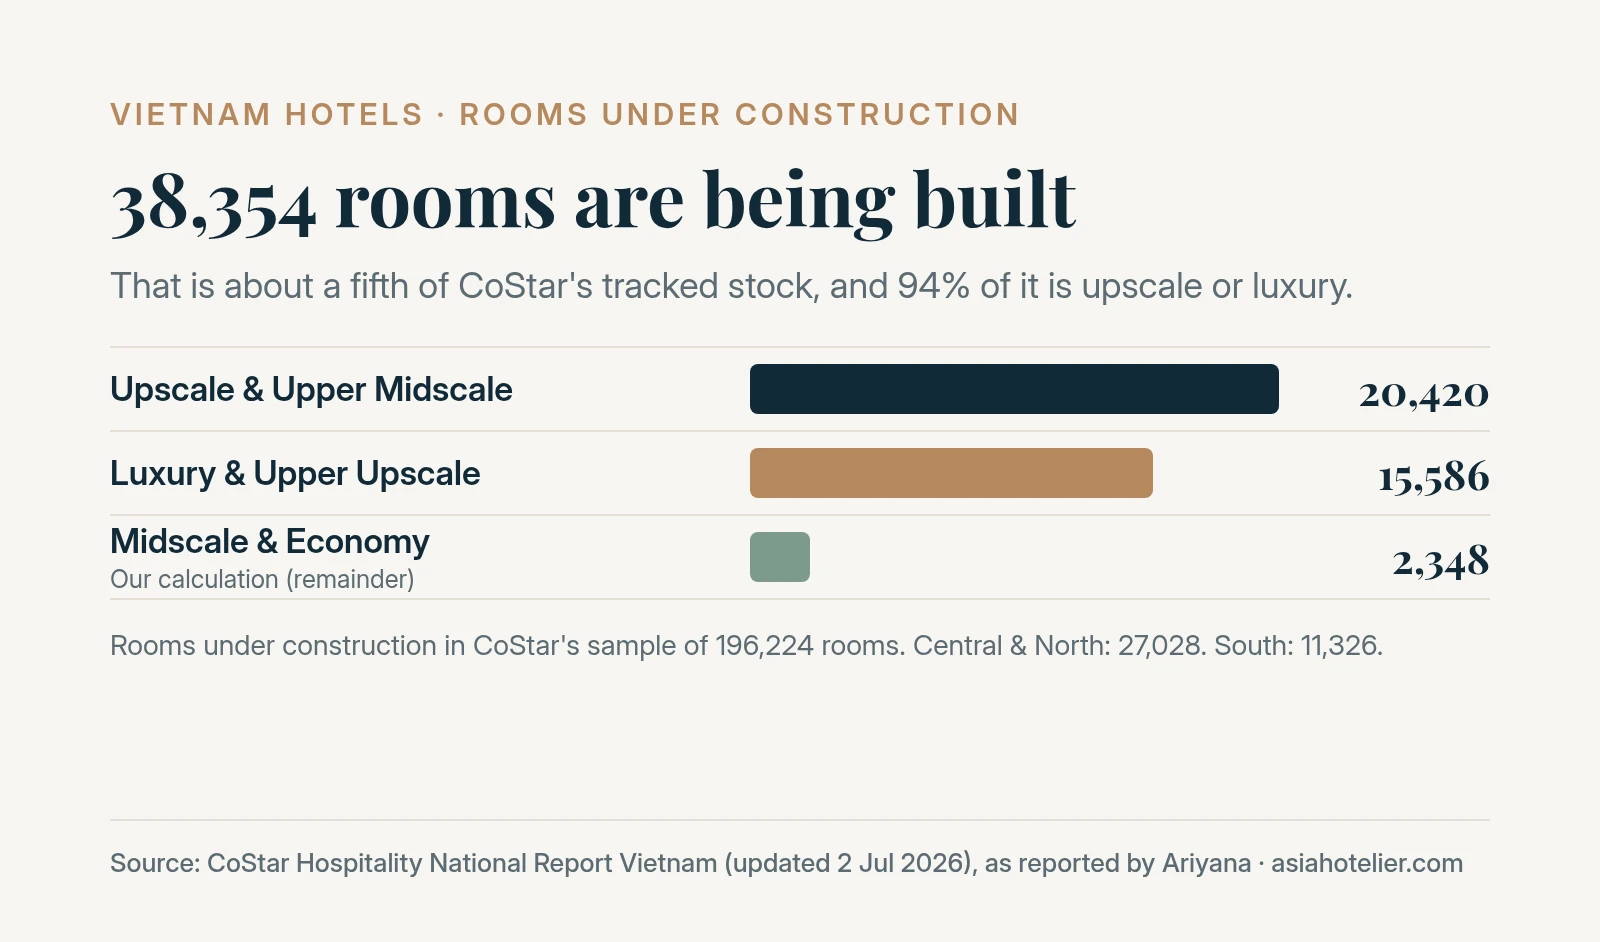
Takeaway: 94% of the rooms being built are upscale or luxury, the tiers trading best today. Owners in those tiers should check local opening dates before setting 2027 rate targets.
Recent deal flow is in the same tiers. Our October openings roundup counts five openings and three signings with 1,949 keys from 15 September to 23 October, 77% of them in Hanoi and Quang Ninh. In Phu Quoc, Sun Group plans about 17,400 rooms and serviced apartments in 2026–27 ahead of APEC 2027, against 26,461 rooms on the island at the end of 2024. Our Sun Group–Marriott story covers that build-out.
Key city and resort markets
We use only published local figures. The NSO’s January–August data shows accommodation and food revenue growing fastest in resort provinces.
| Province | Accommodation and food revenue, January–August 2026 | Main hotel markets |
|---|---|---|
| Da Nang | +21.4% | Da Nang, Hoi An |
| Khanh Hoa | +20.4% | Nha Trang, Cam Ranh |
| Hue | +20.2% | Hue |
| Lam Dong | +19.5% | Da Lat, Mui Ne |
| Bac Ninh | +19.0% | Bac Ninh |
| Ninh Binh | +18.7% | Ninh Binh |
| Gia Lai | +18.2% | Quy Nhon, Pleiku |
| Thanh Hoa | +17.5% | Sam Son |
| Hai Phong | +16.8% | Hai Phong |
| Can Tho | +16.5% | Can Tho |
| Hanoi | +14.4% | Hanoi |
| Ho Chi Minh City | +13.9% | Ho Chi Minh City, Vung Tau |
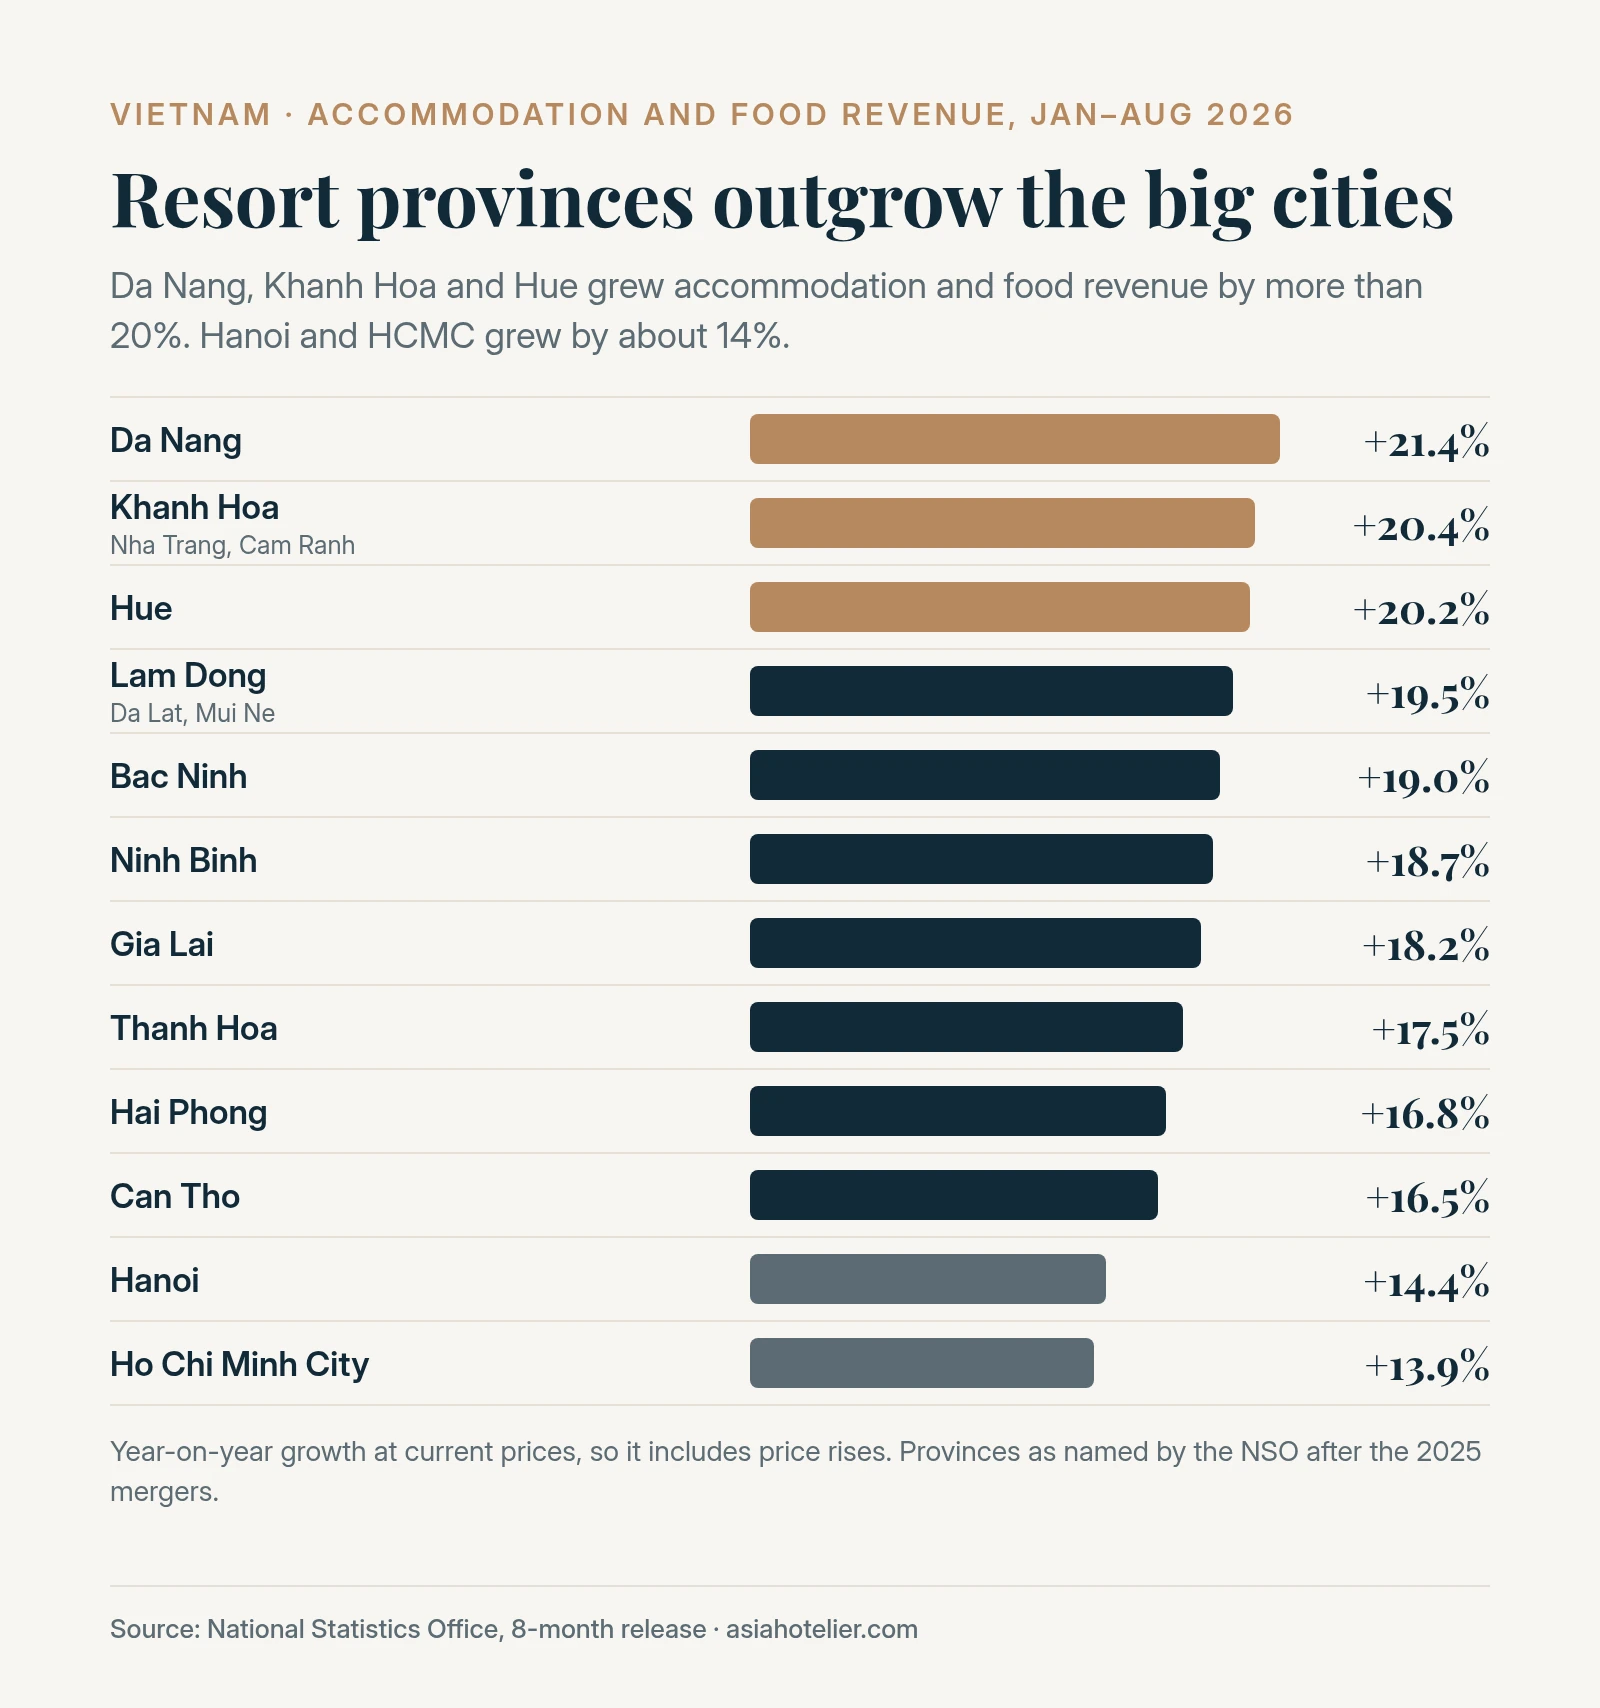
Takeaway: Da Nang, Khanh Hoa and Hue are outgrowing Hanoi and Ho Chi Minh City. Investors weighing resort against city exposure should note the gap, remembering it is at current prices.
CoStar splits its sample into two regions. Over the past 12 months the South traded better, while the Central & North region holds most of the rooms and most of the pipeline.
| CoStar region, 12 months | Rooms tracked | Occupancy | ADR | RevPAR |
|---|---|---|---|---|
| Vietnam South | 60,698 (30.9%) | 64.4% | US$124.04 | US$79.86 |
| Vietnam Central & North | 135,526 (69.1%) | 58.8% | US$111.10 | US$65.29 |
Revenue growth is at current prices, so part of it is price increases. Local supply data is patchy; see our stories on Centara Van Don and Shilla Monogram Hanoi for two markets.
Outlook
Built only from the figures above:
- Peak season is starting. October to March is the international peak, according to Viet Nam News, and the fourth quarter must average at least 2.4 million arrivals a month to reach 25 million.
- At the current pace, 2026 lands below target. If full-year arrivals grow at the nine-month rate of 14.5%, 2026 ends at about 24.3 million (21.2 million × 1.145, our calculation).
- Supply growth will pick up. 38,354 rooms are under construction, about a fifth of tracked stock, mostly upscale and luxury, against supply growth of 2.8% so far in 2026.
- Costs are rising. Consumer prices are up 4.52% this year, above target, and utilities were the fastest-rising hotel cost line in 2024.
- The segments are splitting. Luxury and upscale occupancy is above 63%, while midscale and economy occupancy is at 44.3% and falling.
- APEC 2027 is a fixed date. Phu Quoc hosts the APEC Economic Leaders’ Meeting in November 2027, with Sun Group’s planned 17,400 rooms due in 2026–27.
Our view: national demand supports holding rate into 2027, but the case is weakest for midscale and economy hotels and in markets where large pipelines open at once.
FAQ
What is Vietnam’s hotel occupancy rate in 2026?
63.9% for the year to date in CoStar’s national report updated on 2 July 2026, against 58.4% for the whole of 2025. The 2026 figure covers the first five months, which include peak season.
What is the average hotel ADR in Vietnam?
US$124.02 year to date in 2026, according to CoStar, against US$110.57 for 2025. Luxury and upper-upscale hotels averaged US$162.41.
Is hotel supply in Vietnam growing faster than demand?
No. Room supply rose 2.8% and room demand 14.1% in the year to May 2026. But 38,354 rooms are under construction, so supply growth will pick up as they open.
Will Vietnam reach 25 million international arrivals in 2026?
It needs at least 2.4 million a month from October to December, the NSO says. September brought about 1.77 million. At the nine-month growth rate of 14.5%, the year would end at about 24.3 million, by our calculation.
Which source markets are growing fastest?
Europe, up 53.4% in January–August, led by Russia at 1.0 million arrivals, up 165.7%. India rose 38.2%. China was flat and South Korea fell 5.2%.
How many five-star hotels are in Vietnam?
291 five-star establishments with 94,819 rooms at the end of 2025, according to VNAT.
Which hotel markets in Vietnam are growing fastest?
By accommodation and food revenue in January–August 2026: Da Nang (+21.4%), Khanh Hoa (+20.4%) and Hue (+20.2%), according to the NSO.
Sources and method
- Arrivals, target, run rate, prices and revenue: NSO nine-month release (October 2026), eight-month arrivals release (source markets and provincial revenue), and the 2025 annual report.
- Monthly arrivals: NSO reports for January, Q1 (March), April, May, the first half (June), July and August. January’s exact 2.45 million is from VNAT’s statistics portal. February is VNAT’s figure, as reported by the Government portal. September and Q3 are the NSO’s, as reported by Viet Nam News. Monthly figures are estimates and sum to about 17.7 million.
- Hotel performance, demand, supply, segments, regions, pipeline and costs: CoStar Hospitality National Report Vietnam, updated 2 July 2026, as reported by Ariyana on 19 July 2026. We have not seen the CoStar report itself, so every CoStar figure here is as Ariyana reported it.
- CoStar caveats:
- Year to May. The 2026 occupancy, ADR, RevPAR, demand and supply figures are year to date in a report updated on 2 July, which Ariyana describes as covering the first five months of 2026.
- Not like-for-like. We compare those five months with the whole of 2025. The first five months include Tet and the international peak, so the full-year 2026 figures are likely to be lower. CoStar’s own growth rates (ADR +11.9%, RevPAR +24.2%) are year-on-year and are quoted as reported.
- Sample, not census. CoStar’s 196,224 rooms are its tracked sample, not Vietnam’s total stock. Regional figures are for the past 12 months, not year to date. The cost data is for full-service hotels in 2024.
- Five-star stock: VNAT figures cited in Tạp chí Kinh tế Tài chính, a secondary source, for 2025. The ministry’s October 2025 explanatory note for 2024. The two use slightly different definitions.
- Phu Quoc: Sun Group, 14 July 2026, and the Kien Giang Department of Tourism as reported by Nhan Dan.
- Our calculations:
- Target maths: the 7.3 million still needed, 18% growth needed and 24.3 million at the current pace.
- Run rate: the average month, about 37% above September (7.3 million ÷ 3 ÷ 1.77 million), and Q4 2025 (21.2 million minus 17.7 million ÷ 1.145, about 5.7 million). The Q4 2025 estimate uses rounded totals, so treat it as approximate.
- CoStar ratios: demand ÷ supply, the pipeline share of stock, the midscale and economy pipeline remainder and the GOP margin.
- Gaps: CoStar does not publish its full report openly, and we have not used paywalled figures. NSO’s source-market breakdown for January–September was not in the releases we used.
Changelog
- 5 October 2026: first published.
Data checked on 5 October 2026.